安装
npx -y @deepseek-ai/dsh plugin --profile web add github:stopchewing/dsh-mcp-view此安装命令根据 GitHub 仓库地址生成,是未经验证的安装起点。
README
维护者编写的文档快照。

🔌 dsh-mcp-view
See every MCP server & tool in your DeepSeek Harness session — right in the Web GUI.






A floating MCP inventory panel for the DSH sidebar: servers grouped, tools with JSON schemas, live search, and last-used times pulled from real session logs — nothing invented.
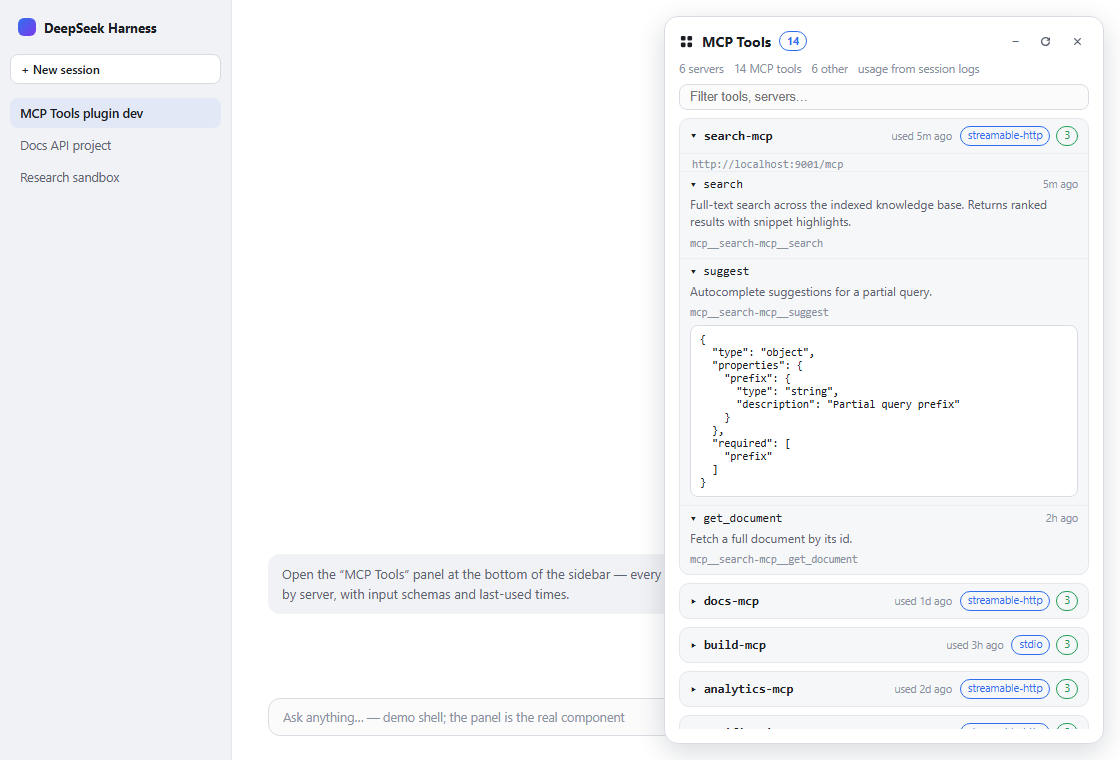
DSH runs your MCP servers (docs, build & analytics — whatever you have configured) and registers their tools into the shared mcp__* namespace — but there was no UI to see them. This plugin adds a one-click panel that answers: what MCP servers are configured, which tools are registered, what their input schemas look like, and when each was last used.
✨ Features
| 🖥 All servers, one panel | Every dsh-mcp-client instance in your profile, with transport (stdio / streamable-http) and endpoint (command or URL), plus connection state (active / disabled / no tools). |
| 🗂 Collapsed by default | Servers are folded into a single compact row; one click expands the tool list. + / − in the header expands or collapses everything. |
| 🧬 Full JSON schemas | Each tool shows its raw name, description and the exact inputSchema the model sees — expandable, prettified. |
| 🕘 Last-used times & usage | Derived from real tool/call events in ~/.dsh/sessions/**/session.jsonl[.zstd] — per tool and per server, plus a Usage tab with total calls, a calls-per-day chart and the most-used tools. |
| 🔍 Live search | Filter by tool name, raw name, description, server or parameter names; auto-refresh every 10 s plus a manual refresh button. |
| 🎯 Per-session view | Toggle to see only the tools the current session's agent really sees (resolved from the session's agent scope). |
| ❤️ Favorites & sorting | Star servers/tools; sort by name / tools / last-used / favorites. State persists in localStorage. |
| ⚕️ Health checks | One-click probe of streamable-http endpoints (HEAD) → up/down badge per server. |
| 📤 Export | Download the whole inventory as JSON or Markdown. |
| 🧩 Non-MCP context | A collapsible list of the other (built-in / plugin) globally-registered tools, so you can see the whole tool landscape at a glance. |
⚙️ Configuration
The plugin accepts an optional config object on its row in cordis.patch.yml:
- insert:
    - id: mcp-view
      name: 'dsh-mcp-view'
      config:
        enabled: true          # master switch (default true)
        announceToAgent: true  # announce the plugin in the model's prompt band (default true)
📸 Screenshots
| Light | Dark | |
|---|---|---|
| Servers | | 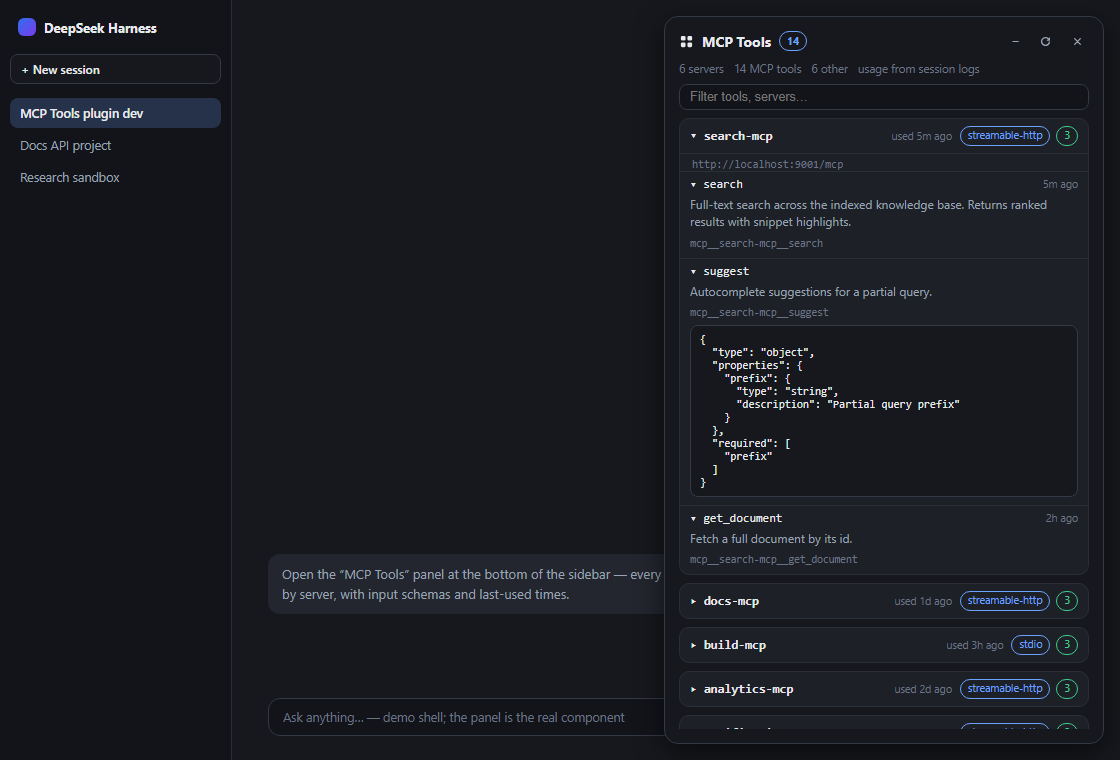 |
| Usage | 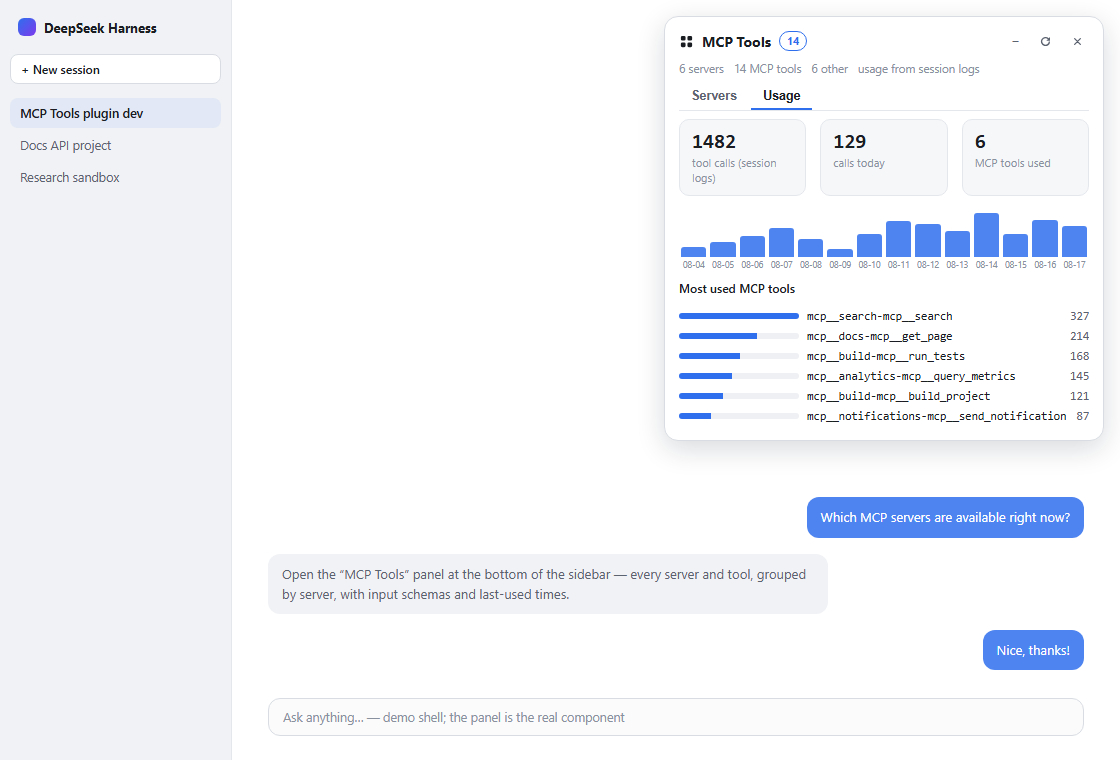 | 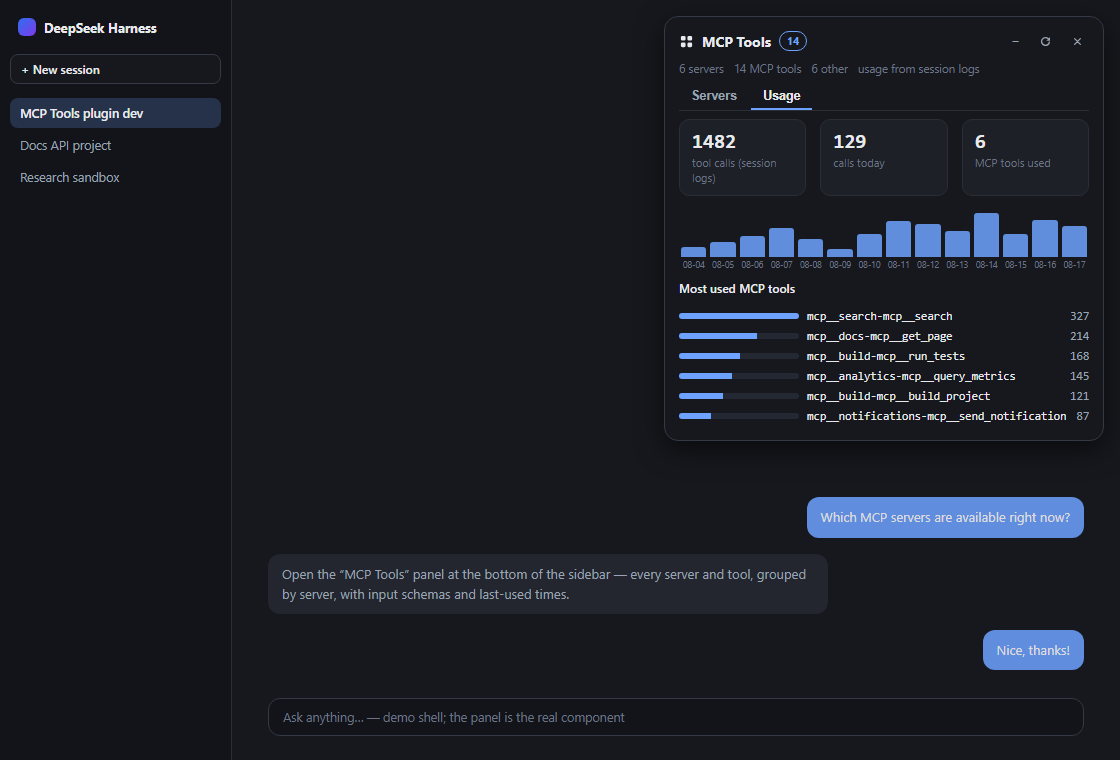 |
⚡ Quick start
git clone https://github.com/stopchewing/dsh-mcp-view.git
cd dsh-mcp-view
dsh plugin --profile web add link:$(pwd)
Then restart dsh web and refresh the page — a 「MCP Tools」 button appears at the bottom of the sidebar.
📦 Install
From npm
dsh plugin --profile web add dsh-mcp-view
From the repository
git clone https://github.com/stopchewing/dsh-mcp-view.git
dsh plugin --profile web add link:/absolute/path/to/dsh-mcp-view
Manual (no CLI)
-
Put this package into the profile's
node_modules(copy, or a junction on Windows):New-Item -ItemType Junction -Path "$env:USERPROFILE\.dsh\profiles\web\node_modules\dsh-mcp-view" -Target "<abs-path>\dsh-mcp-view" -
Append to
~/.dsh/profiles/web/cordis.patch.yml:- insert: - id: mcp-view name: 'dsh-mcp-view' -
Restart
dsh web, then F5 the page.
The profile patch is watched, so the host half activates live; the client bundle is served fresh at
/plugins/dsh-mcp-view/client.js— a page refresh is all the browser needs.
🎛 Usage
- Click 「MCP Tools」 in the sidebar footer (icon-only when the sidebar is collapsed).
- Browse servers — each row shows transport, tool count and last use; click to expand tools.
- Click a tool to see its description, full public name and JSON input schema.
- Type in the filter box to narrow tools and servers;
Escor ✕ closes the panel.
🗺 Architecture
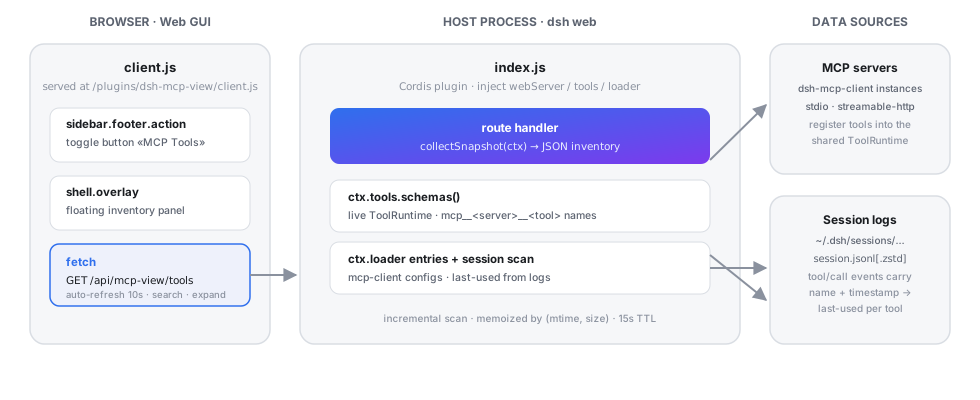
| Half | File | Role |
|---|---|---|
| Host | lib/index.js | GET /api/mcp-view/tools returns the JSON inventory: MCP instances from the Cordis loader, live tool schemas from ctx.tools, and last-use history scanned from session logs (incremental scan memoized by file mtime/size, 15 s TTL). |
| Browser | lib/client.js | Client plugin bundle: registers the sidebar toggle in the sidebar.footer.action slot and the floating panel in the shell.overlay slot. |
No changes to dsh sources — it is a hot-pluggable profile plugin, same mechanism as the @linxin666 web-ui family.
🔒 Security & privacy
- Local-only. Everything runs in your dsh host process and browser; the only network traffic is to the MCP servers you already configured.
- No telemetry, no analytics, no external calls — the panel never leaves your machine.
- The
/api/mcp-view/toolsroute is served by the same-origin webserver; it is read-only — it cannot call MCP tools, only list them. - Last-used times come from your own session logs on disk; nothing is sent anywhere.
- Passwords / credentials of your MCP servers are never exposed — only transport type and endpoint URL.
🧩 Compatibility
@deepseek-ai/dsh0.1.0-rc.6(web profile) — same cadence as the ecosystem's pinned SDK versions.- Node
^22.19.0 || >=24.0.0(the dsh runtime requirement — zstd session decoding is used). - Browser: Chrome / Edge / Firefox (React 18, no build step for the client bundle).
❓ FAQ
Are MCP servers per-session or shared?
Shared. MCP servers are configured once at the profile level (cordis.patch.yml), connect once per process, and register their tools into the process-wide ToolRuntime — every session and workspace sees the same set. A session whose agent preset restricts tools may hide them from the model, but the registry stays global.
Where does «used …» come from?
From tool/call events in your persisted session logs (~/.dsh/sessions). It is the real dispatch timestamp of the last call of that tool. If the log has no calls for a tool, the hint is simply absent.
Why are only some tools listed under "Other tools"?
The panel shows the global registry. Per-session agent tools (e.g. pwsh, read) register in the session's scope layer, so they are not part of the global view.
Does the panel slow things down? No. The session scan is incremental (only changed files are re-read) and rate-limited to once per 15 s; the browser auto-refresh is 10 s.
🛠 Development
dsh-mcp-view/
├─ src/
│  └─ index.ts      # host plugin (TypeScript): route + inventory + session scan
├─ lib/
│  ├─ index.js      # compiled host output (npm run build)
│  └─ client.js     # browser bundle (window.__ModuleLoader__)
├─ test/            # node --test unit tests
├─ cordis.patch.yml # profile roster insert
├─ docs/            # preview data, template, screenshots, architecture
└─ package.json     # dsh.bundle.patch + dsh.client manifest
The host plugin is written in TypeScript (src/index.ts); compile it with
npm run build (emits lib/index.js + types). The browser bundle
(lib/client.js) uses the DSH module-loader format and is maintained as a
checked JS bundle. Run npm test (Node's built-in test runner) and
npm run typecheck locally.
Rebuild the README preview screenshots (requires Chrome):
# 1. merge live inventory + session scan into docs/preview.html
#    (docs/preview-data.json + docs/preview.template.html → docs/preview.html)
# 2. screenshot with headless Chrome:
chrome --headless=new --screenshot=docs/screenshots/panel-light.png --window-size=1120,760 "file:///abs/path/docs/preview.html?theme=light"
#    repeat with ?theme=dark
🤝 Contributing
Found a bug, want a new view (per-session visibility, tool stats, dark-mode polish)? Open an issue or send a PR — they're welcome.
Star ⭐ this repo if the panel made your MCP tooling visible — it helps other DSH users find it (and it keeps the maintainers motivated). After your first release, submit it to awesome-dsh-plugin and awesome-deepseek-harness to reach the whole ecosystem.
📜 License
MIT © 2026 stopchewing
项目文件与信号
以下项目是目录快照中检测到的公开仓库信号。
仓库信息
- 开发语言
- JavaScript
- 许可证
- MIT
- 最新发布
- v0.2.1
- 最后更新
- 2026年8月18日 03:19
谨慎安装
请检查源代码、权限、生命周期脚本、依赖与网络访问;不受信任的插件应先在隔离环境中测试。