Installation
npx -y @deepseek-ai/dsh plugin --profile web add github:BrambleXu/dsh-annotateThis installation command is an unverified starting point generated from the GitHub repository address.
README
Maintainer-authored documentation snapshot.
dsh-annotate





English | 中文
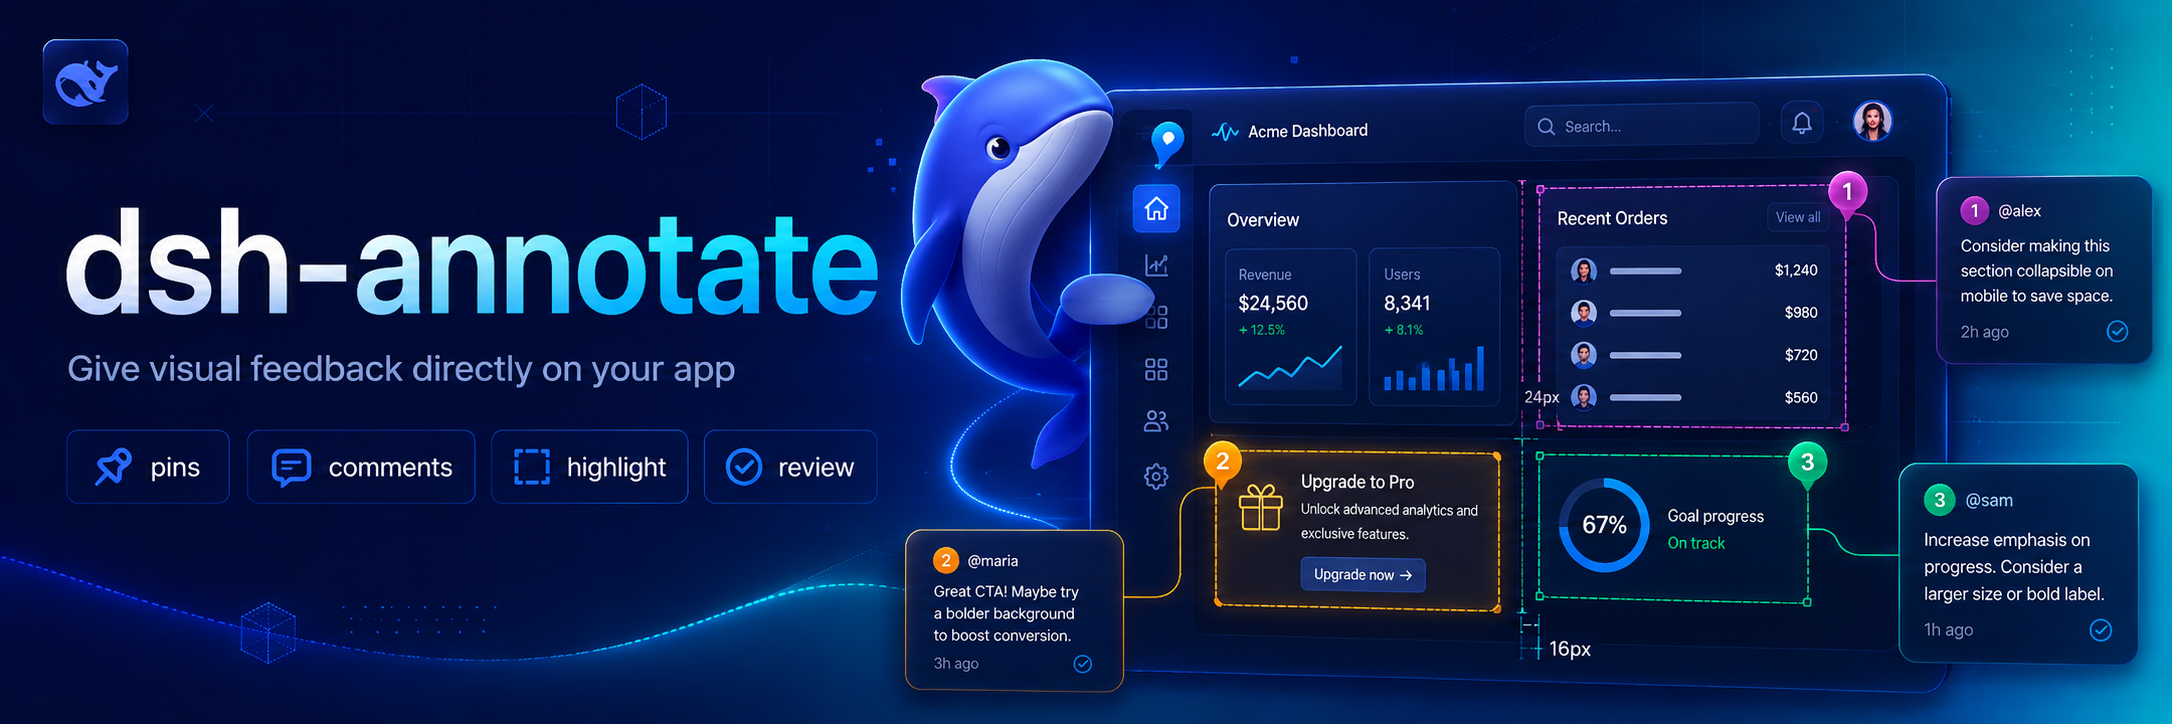
Visual browser feedback for DeepSeek Harness. /annotate asks the companion Chrome extension to enter selection mode; each selected element contributes a selector, DOM facts, computed style highlights, accessibility data, a comment, and an optional viewport screenshot to the agent's next turn.
Why this exists 💡
Browser UI problems are difficult to describe precisely through plain text. dsh-annotate lets you point at the relevant element and send the Agent the surrounding browser facts, so visual feedback stays attached to the page element instead of becoming a vague description or a copied screenshot.
Features ✨
- Select elements directly in Chrome or Chromium through
/annotate. - Capture selectors, DOM facts, computed-style highlights, accessibility data, comments, and optional viewport screenshots.
- Send structured annotations to the Agent through a local loopback WebSocket bridge.
- Restrict browser connections by loopback host, extension origin, and optional extension ID.
Install 📦
Add the plugin project to a Harness profile:
dsh plugin --profile demo add ./dsh-annotate
Then install the companion extension:
- Open
chrome://extensionsin Chrome or Chromium. - Enable Developer mode.
- Choose Load unpacked and select this project's
browser-extensiondirectory. - Open the extension popup and keep the default bridge endpoint.
For tighter local authorization, copy the extension ID shown in the popup into allowedExtensionId in a later Harness patch layer.
Use 🚀
/annotate
/annotate http://localhost:3000
Click an element, enter its comment, and repeat as needed. Submit sends all captured facts and the visible-tab screenshot to the agent. Escape cancels.
Configure ⚙️
- id: dsh-annotate
  name: dsh-annotate
  config:
    host: 127.0.0.1
    port: 43119
    allowedExtensionId: abcdefghijklmnopqrstuvwxyzabcdef
    requestTimeoutMs: 300000
    maxPayloadBytes: 16777216
    includeScreenshot: true
The server refuses non-loopback hosts and browser connections whose origin is not chrome-extension://. An empty allowedExtensionId accepts any locally installed Chrome extension; set the exact ID for stricter isolation.
Develop 🧑💻
pnpm install
pnpm run check
Reload the unpacked browser extension after editing its files.
Scope 🎯
Version 0.1 targets one local Chrome/Chromium browser, one active tab, and visible-viewport screenshots. Remote browsers, full-page capture, edit recording, and inline draggable note cards are deferred.
License 📄
MIT
Credits 🙏
The interaction is inspired by pi-annotate. This implementation is built around Harness's human-command, attachment, and Agent APIs and uses a small loopback WebSocket bridge instead of a native-messaging host.
Project files and signals
Shown items are public repository signals detected in the directory snapshot.
Repository information
- Language
- TypeScript
- License
- MIT
- Latest release
- v0.1.0
- Last updated
- Aug 14, 2026, 6:55 AM
Install deliberately
Review source code, permissions, lifecycle hooks, dependencies and network access. Test untrusted plugins in an isolated environment.